Why Does Your Friday Revenue Meeting Run on Spreadsheets? (2026)


Table of Contents
- Introduction
- Why does your Friday revenue meeting still run on spreadsheets someone built at 6am?
- What is AI workflow automation for manual executive reporting in a small business?
- Which leadership reports should you rank and automate before Friday?
- How do you build cross-system revenue visibility without buying enterprise BI?
- How do n8n scheduled pulls replace the Friday morning export scramble?
- How should Claude write the narrative and flag anomalies in the revenue pack?
- What daily and weekly actions keep pipeline accuracy honest?
- What mistakes freeze Friday reporting automation after the first green checkmark?
- What should you read next before you wire another integration?
- Frequently Asked Questions (FAQs)
- Next step: turn Friday prep into a reliable revenue ritual
Introduction
Thursday afternoon, leadership pings Slack: "Can we see updated pipeline numbers tomorrow?" By Friday at 6am, someone is exporting CRM deals, ad spend, support tickets, and billing rows into a spreadsheet deck that leadership will treat as truth at 9am. Half the numbers are already stale. Nobody is sure which pipeline figure is "the real one."
That is not a discipline problem. It is a manual reporting automation gap. AI workflow automation for small business teams can rank which executive reports matter, pull cross-system revenue data on a schedule, and use Claude for narrative plus anomaly flags, without buying enterprise BI or hiring a data org.
This post is about the Friday sales and revenue leadership review, not the Monday ops KPI pack. If your pain is weekly operational tiles and connector hygiene, read Why does rebuilding Monday ops reports by hand still tax time, trust, and revenue?. Here we focus on pipeline accuracy, forecast credibility, and cross-system revenue visibility for the meeting where targets get reset.
Why does your Friday revenue meeting still run on spreadsheets someone built at 6am?
Your Friday revenue meeting still runs on spreadsheets because nobody owns a single pipeline definition across CRM, ads, billing, and support, so the fastest fix is a heroic export-and-stitch session before leadership wakes up.
Three taxes show up every week.
The time tax. A modest leadership pack, pipeline by stage and owner, channel performance, billing reality, support risk on key accounts, easily burns three to five senior hours once you fix VLOOKUPs, reconcile date ranges, and rebuild charts. Across a year that is weeks of selling and operating time spent on copy-paste.
The delay tax. When the deck only updates when someone has bandwidth, you steer from last week while this week burns cash. Coverage ratios look fine in the spreadsheet because stale deals never got closed-lost.
The trust tax. Marketing quotes leads one way, sales quotes pipeline another, finance quotes recognized revenue a third. The meeting opens with reconciliation instead of decisions. Leadership learns to distrust the deck, then distrust each other.
Automation will not fix politics. It does remove the excuse that numbers were wrong because someone misclicked an export. When the pipeline is boring, the conversation shifts from "is this true?" to "what do we do?"
There is also a scavenger-hunt tax. Finance chases billing, marketing chases spend, RevOps chases CRM hygiene, support chases ticket severity. Each ping is small; the total is a distributed job spread across calendars. One refreshed Friday pack collapses that hunt before the room fills.
What is AI workflow automation for manual executive reporting in a small business?
AI workflow automation for small business means connecting your CRM, ads, billing, and support tools on a schedule, then using an AI model for steps that need judgment, like summarizing trends and flagging outliers, while humans approve what leadership sees.
Traditional workflow automation runs predictable if-then steps: pull data, transform fields, write rows, send email. That alone eliminates most of the Friday export scramble. Adding AI handles the parts spreadsheets do badly: explaining why pipeline dropped in one segment, spotting a channel whose spend rose while qualified pipeline fell, or calling out accounts with severe tickets and overdue invoices.
For executive reporting, the pattern looks like this:
- Trigger - time-based, every Friday at 6am (or Thursday night if your billing cycle closes late).
- Orchestrated pulls - APIs fetch deals, spend, invoices, and tickets with the same filters every week.
- Transform and unify - map campaign IDs to CRM sources, compute coverage, week-over-week deltas, and risk tags.
- AI narrative layer - structured JSON goes to Claude; you get a short summary and anomaly list with definitions baked into the prompt.
- Human review - RevOps spot-checks before the pack hits leadership inboxes.
- Delivery - email, Slack, or a living doc with freshness timestamps on every block.
You are not building a warehouse. You are building a reliable Friday ritual. That is squarely inside what modern manual reporting automation tools can deliver for teams without a dedicated analytics org.
Which leadership reports should you rank and automate before Friday?
Rank executive reports by how often leadership asks for them, how repeatable the mechanics are, and how much a wrong number changes hiring, spend, or targets. Automate the top four before you touch niche cohort analyses.
| Report | Why it ranks high | Primary sources |
|---|---|---|
| Weekly pipeline and forecast snapshot | Backbone of Friday review; same questions every week | CRM |
| Channel and campaign performance vs pipeline | Links spend to revenue-quality opportunities | Ads + CRM |
| Customer health and support risk | Surfaces churn before it hits the forecast | Support + billing |
| Billing and collections summary | Separates booked, billed, and collected revenue | Billing |
Pipeline and forecast first. Total pipeline, weighted forecast, coverage versus target, new pipeline added versus lost, stuck deals by age. Once CRM fields and stage definitions are locked, pulling and aggregating is fully mechanical. This is your highest-ROI starting point.
Channel performance second. Leadership always asks whether paid and organic acquisition produce closable pipeline. Bridge ad conversions to CRM opportunities via UTMs, form IDs, or enforced lead source fields. Without that bridge, channel slides stay opinion.
Support risk third. Open severe tickets on high-ARR accounts, repeated payment failures, downgrade requests. These signals live outside the CRM but change revenue decisions. Workflow automation watches multiple systems without anyone logging in.
Billing summary fourth. New invoices paid, overdue aging, failed charges. Finance's "real revenue" view belongs beside pipeline, not in a separate thread after the meeting.
Everything else, cohort retention curves, detailed unit economics, creative-level ad breakdowns, waits until these four refresh reliably. Use What Should You Automate First? A Revenue-First Prioritization Framework to score candidates if leadership keeps adding "just one more slide."
How do you build cross-system revenue visibility without buying enterprise BI?
Cross-system revenue visibility means one Friday pack where pipeline, acquisition efficiency, billing reality, and support risk share the same definitions, timestamps, and owners, pulled from four layers: sources, orchestration, light storage, and delivery.
Sources are systems of record. CRM holds stages, amounts, owners, and close dates. Ad platforms hold spend and tracked conversions. Billing holds charges, subscriptions, refunds, and failures. Support holds ticket severity and account linkage.
Orchestration is scheduled glue. Friday at 6am, jobs extract deltas, normalize time zones and currency, map campaigns to lead sources, and upsert rows into a staging table or sheet you treat as production. n8n, Make, or Zapier earn their keep here. The pattern is intentionally boring: fetch, clean, write, log.
Storage can be Postgres, a guarded Google Sheet, or a modest BI front end. Postgres wins once VLOOKUP chains become the risk. Keep derived tables small: weekly pipeline by stage, weekly spend by platform, billing aging buckets, support risk flags per account.
Delivery is whatever leadership actually opens: a two-minute email summary, a Slack post with tables, or a single doc linked from the calendar invite. Fancy charts matter less than consistent definitions and visible "last synced at" stamps.
You do not need a star schema on day one. You need honest joins on boring keys. Email is a weak global ID but often the only bridge between a form submission, CRM contact, and billing customer. Use it early, then plan a stable customer_id once product and finance agree.
This Friday pack is different from a Monday ops dashboard. Monday ops cares about operational KPI tiles refreshed for the week ahead. Friday leadership cares whether the forecast is credible, which deals need executive air cover, and whether acquisition efficiency still supports the target. Same systems, different questions, different ranking of what belongs above the fold.
How do n8n scheduled pulls replace the Friday morning export scramble?
n8n scheduled pulls replace the scramble by running the same CRM, ads, billing, and support exports automatically at a fixed time, with retries, logging, and exception queues, so RevOps reviews output instead of building it from scratch.
A practical Friday workflow in n8n:
- Schedule trigger - Cron for Friday 05:45 in your business time zone (adjust if billing closes Thursday night).
- CRM branch - Pull opportunities updated in the last seven days; required fields: stage, amount, owner, close date, lead source.
- Ads branch - Pull account- or campaign-level spend and conversions for the same window.
- Billing branch - Pull new charges, failures, refunds, and overdue invoices.
- Support branch - Pull open tickets above severity threshold on accounts above ARR cutoff.
- Merge and compute - Aggregate pipeline by stage, compute week-over-week deltas, tag stuck deals, map spend to sourced pipeline where keys exist.
- Exception log - Write failed API calls, missing owners, and unmapped campaigns to a triage table.
- Handoff to AI - Send structured JSON to Claude for narrative and anomaly flags.
- Deliver - Post to Slack and email with tables plus summary; attach freshness metadata per source.
Treat orchestration like production code. Version workflows, rotate credentials outside chat logs, document happy path and top three failure modes. When an API returns a partial page, decide whether the job halts, retries with backoff, or continues with a watermark you reconcile manually.
If your team already runs Monday KPI pulls, reuse connectors and field mappings where definitions align. Do not fork two conflicting pipeline formulas. One metrics dictionary should feed both cadences, with different rollups for ops versus leadership.
How should Claude write the narrative and flag anomalies in the revenue pack?
Claude should receive structured metrics plus your written definitions, then produce a short leadership summary and a bullet list of anomalies with evidence, never inventing numbers that are not in the payload.
Feed structured data, not raw CSV dumps. JSON with labeled sections: pipeline totals, forecast, coverage ratio, channel table, billing summary, support risk list, exception count. Include week-over-week deltas and the exact date range.
Lock definitions in the prompt. State what "qualified pipeline," "forecast," "new pipeline," and "at-risk account" mean in your business. The model will mirror sloppy language if you leave terms ambiguous.
Ask for two outputs. A three-to-five paragraph narrative for executives who will not open tables, and an anomaly section with explicit thresholds: pipeline down more than X percent in a segment, spend up while sourced pipeline flat, accounts with both severe tickets and overdue invoices, deals stuck past N days in the same stage.
Use a smaller model for classification, a larger one for narrative. Haiku or Sonnet can tag risk tiers on accounts; Sonnet or Opus drafts the Friday summary. Routing saves cost without sacrificing readability.
Keep humans in the loop early. Weeks one through four, RevOps reads every AI paragraph against the tables before leadership sees it. Over-trusting plausible language when inputs are dirty is the fastest way to lose the room.
Claude is a drafting assistant, not a source of truth. Fix joins and definitions first; let the model explain a trustworthy pack, not apologize for a broken one.
What daily and weekly actions keep pipeline accuracy honest?
Pipeline accuracy depends on shared definitions, freshness stamps, exception triage, and spot checks, not on more charts.
Daily things to do (15-20 minutes)
- Clear the exception queue: missing owners, unmapped campaigns, failed API calls from the last run.
- Spot-check two deals that moved stages against the CRM UI; confirm amounts and close dates match what automation pulled.
- Reply to any data-quality Slack thread from sales about miscategorized sources before bad tags replicate in Friday's channel slide.
Weekly things to do before the Friday meeting (30-45 minutes)
- Confirm freshness metadata on the pack: when each source last synced and which time windows the tables cover.
- Reconcile pipeline total and forecast once against CRM native reports using the same filters documented in your metrics dictionary.
- Read Claude's anomaly list and mark each item real, artifact, or needs context for the meeting.
- Update the leadership agenda so discussion assumes automated numbers; reserve time for decisions, not re-derivation.
- Log hours saved versus the old manual build; attach a rough dollar value to senior time reclaimed.
Definitions to keep in one living document
| Term | Example definition |
|---|---|
| Qualified pipeline | Open opportunities from Stage 2+ with amount and close date |
| Forecast | Sum of amount x stage probability, frozen Thursday 6pm |
| New pipeline | Opportunities created in trailing seven days |
| At-risk account | ARR above threshold AND (severe open ticket OR invoice 30+ days overdue) |
Automation amplifies discipline. Empty CRM hygiene hurts faster than any missing AI feature. Tighten required fields and picklists in parallel with technical work.
What mistakes freeze Friday reporting automation after the first green checkmark?
The usual freeze patterns are undefined process, ignored data hygiene, over-trusted AI copy, and scope creep on slides nobody uses.
Automating an undefined process. If leadership's questions change every Friday, workflows break. Standardize the core four reports first, then automate.
Metric inflation on the leadership deck. Every executive adds "just one more slide" until the pack is wallpaper. Guard the home view; park experiments in appendix tabs.
Ownerless automation. If nobody owns credential rotation, schema drift when CRM renames a field, and prompt updates when definitions change, the pipeline rots. RACI applies to low-code.
Perfect data paralysis. You do not need ten years of historical parity on day thirty. You need consistent definitions from go-live forward plus a controlled backfill when ready.
Tool tourism. Swapping orchestration vendors because a demo looked shinier replays the same movie. The hard part is definitions and ownership, not canvas aesthetics.
Skipping measurement. Track hours reclaimed, error reduction, and faster decisions. If you cannot say "we got four senior hours back every Friday," leadership files automation under "nice IT project."
What should you read next before you wire another integration?
Pair this Friday leadership angle with posts that cover adjacent ground without duplicating the Monday ops KPI path.
- Why does rebuilding Monday ops reports by hand still tax time, trust, and revenue? - operational KPI pulls and connector hygiene for Monday ops, not executive pipeline review.
- Your team is the API between CRM, Slack, and spreadsheets - map human handoffs before you automate the highest-leak step.
- 90-Day AI Automation Roadmap Template (Small Business) - week-by-week gates so reporting work does not swallow the roadmap.
- AI Automation ROI: 2-3 Revenue Flows Beat Another Subscription - tie spend to flows that move revenue.
Next step: turn Friday prep into a reliable revenue ritual
You do not need another 6am spreadsheet hero. You need ranked reports, scheduled pulls, honest pipeline definitions, and Claude flagging what humans should scrutinize before the meeting starts.
If you want help ranking which executive reports to automate first and sequencing CRM, ads, billing, and support for your Friday leadership review, reserve your roadmap call and we will map the pack to revenue before anyone opens another export tab.
Frequently asked questions
Quick answers on the topics covered in this article.
Because pipeline, spend, billing, and support live in different systems and nobody agreed on one definition of forecast, so someone still exports and stitches a deck by hand before leadership meets.
It is scheduled pulls from CRM, ads, billing, and support into one pack, with shared metric definitions and human review, so leaders decide from consistent numbers instead of reconciling exports in the room.
Friday review focuses on forecast credibility, pipeline coverage, executive deal risks, and cross-system revenue truth for target decisions. Monday ops focuses on operational KPI tiles and connector health for the week ahead.
Start with the weekly pipeline and forecast snapshot from your CRM. It is high impact, structurally repeatable, and unlocks every other leadership question once definitions are stable.
No. A scheduled orchestration layer, light storage, and a simple delivery format email or Slack with tables often suffice until joins outgrow spreadsheets.
n8n runs scheduled multi-system pulls, transformations, exception logging, and handoff to Claude, with audit-friendly logs your team can maintain without a full engineering org.
Claude should draft the summary and anomaly list from structured JSON you trust, but RevOps should review output against tables before leadership sees it, especially in the first month.
Use one metrics dictionary, freshness timestamps on every block, an exception queue for bad rows, weekly spot checks against native CRM reports, and a human review loop before send.
Clear the exception queue, spot-check a few stage changes in CRM, and fix miscategorized lead sources before they replicate in channel slides.
Measure senior hours reclaimed, fewer pre-meeting reconciliation threads, and faster decisions in the room. Four to six hours back every Friday usually pays for the project quickly.
[[banner-roadmap-call]]
Share this article
Related workflows
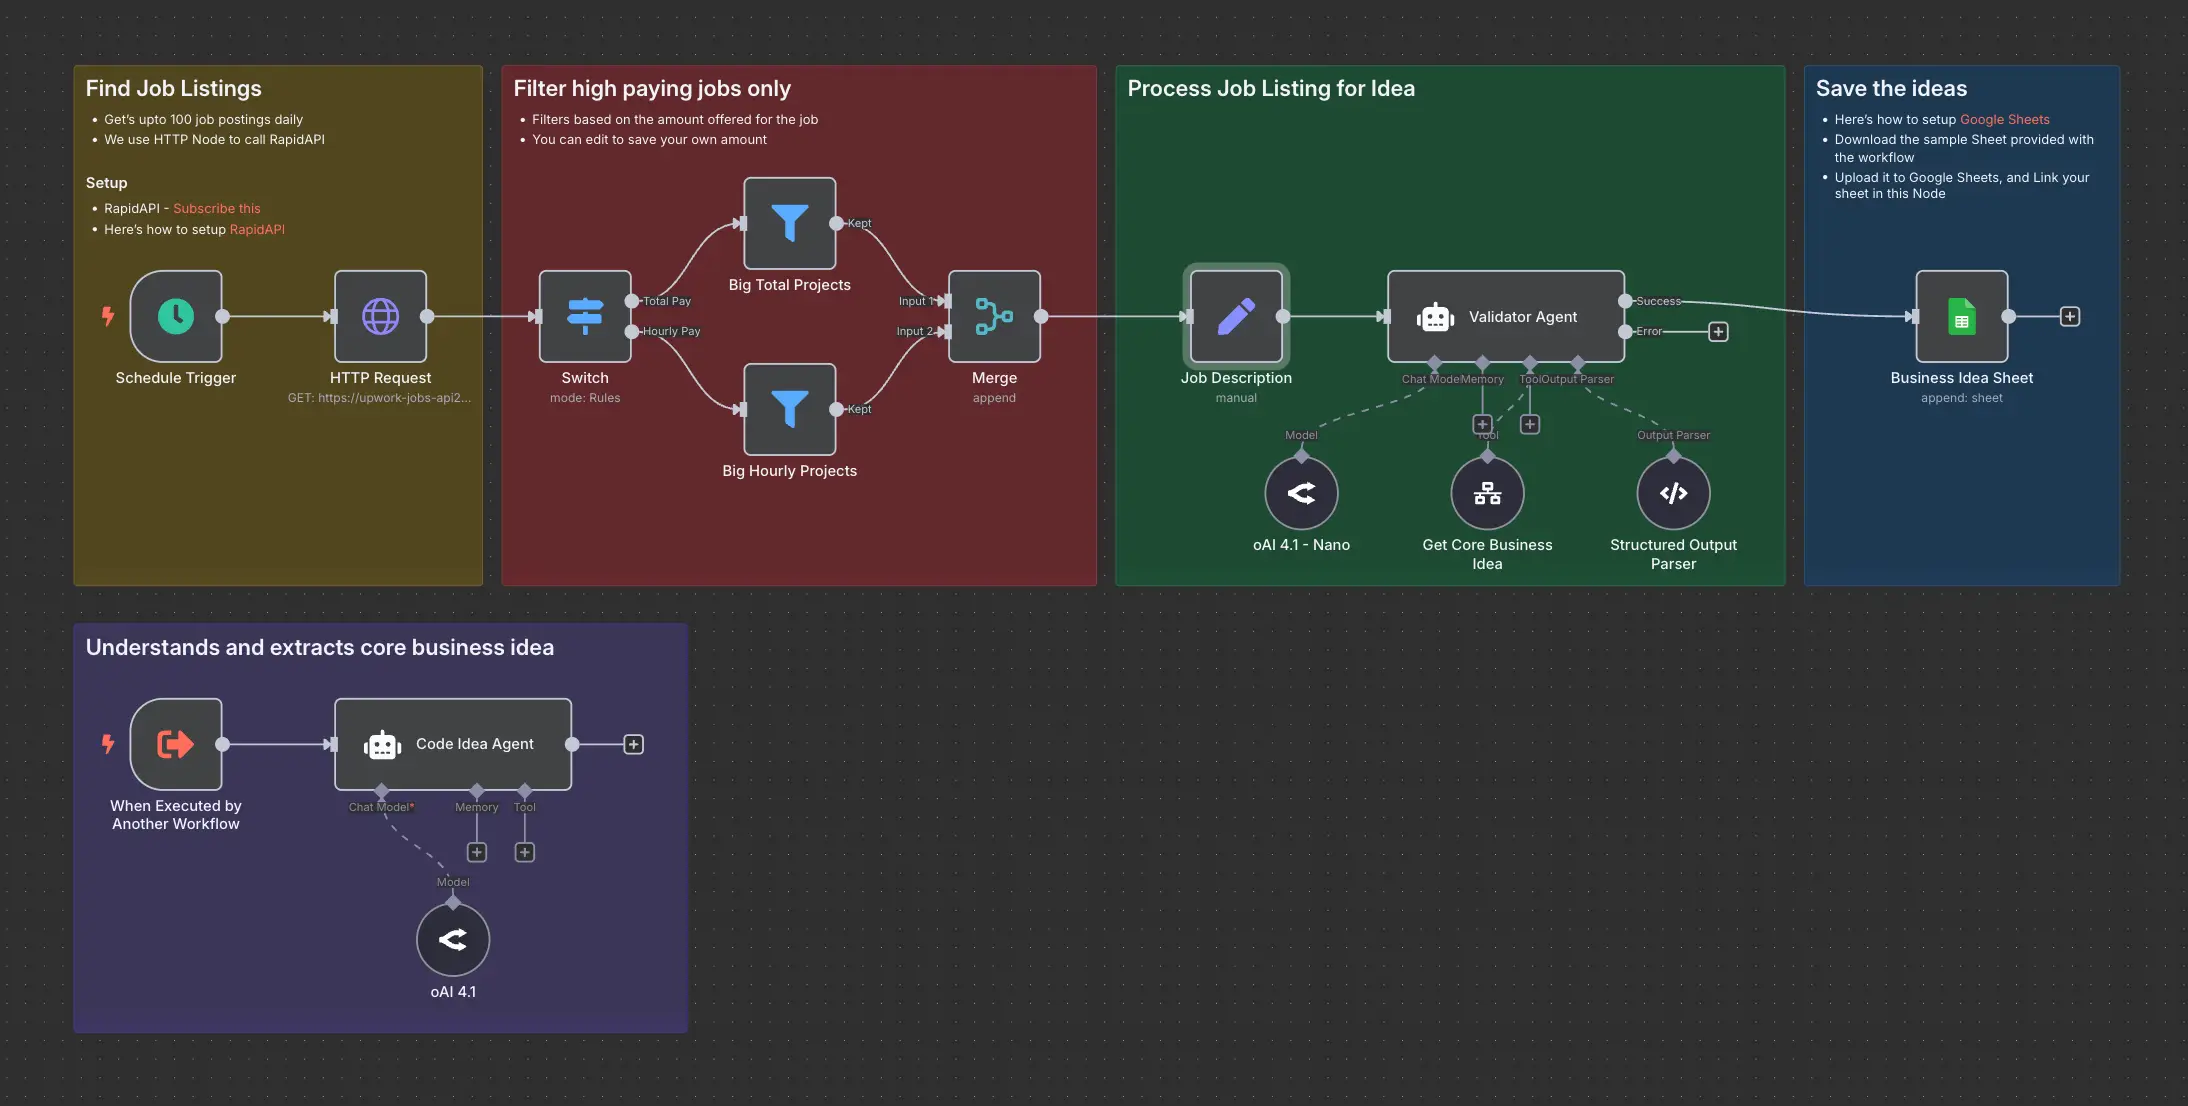
Daily Validated Business Ideas using n8n and Upwork
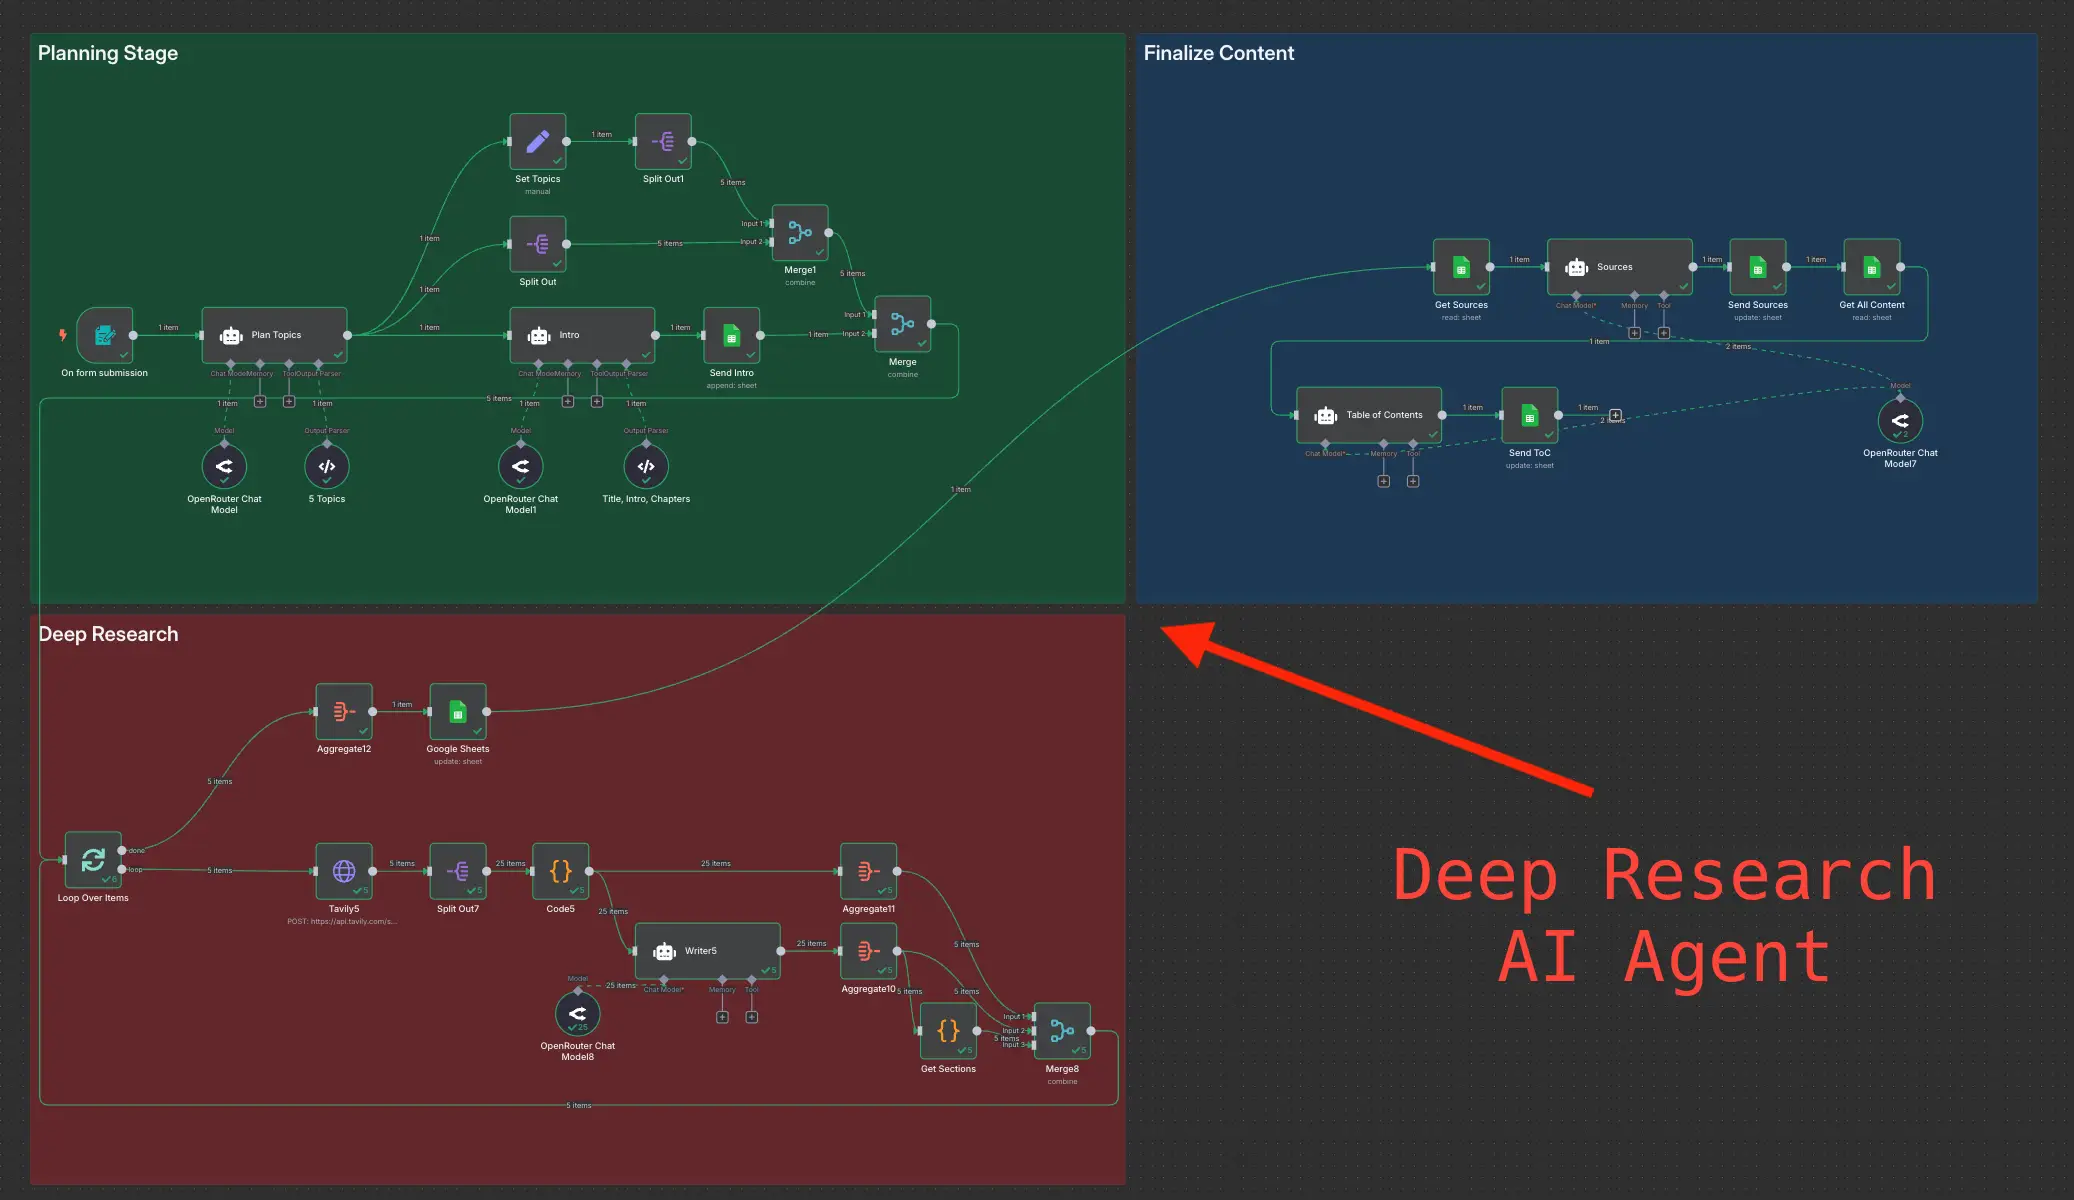
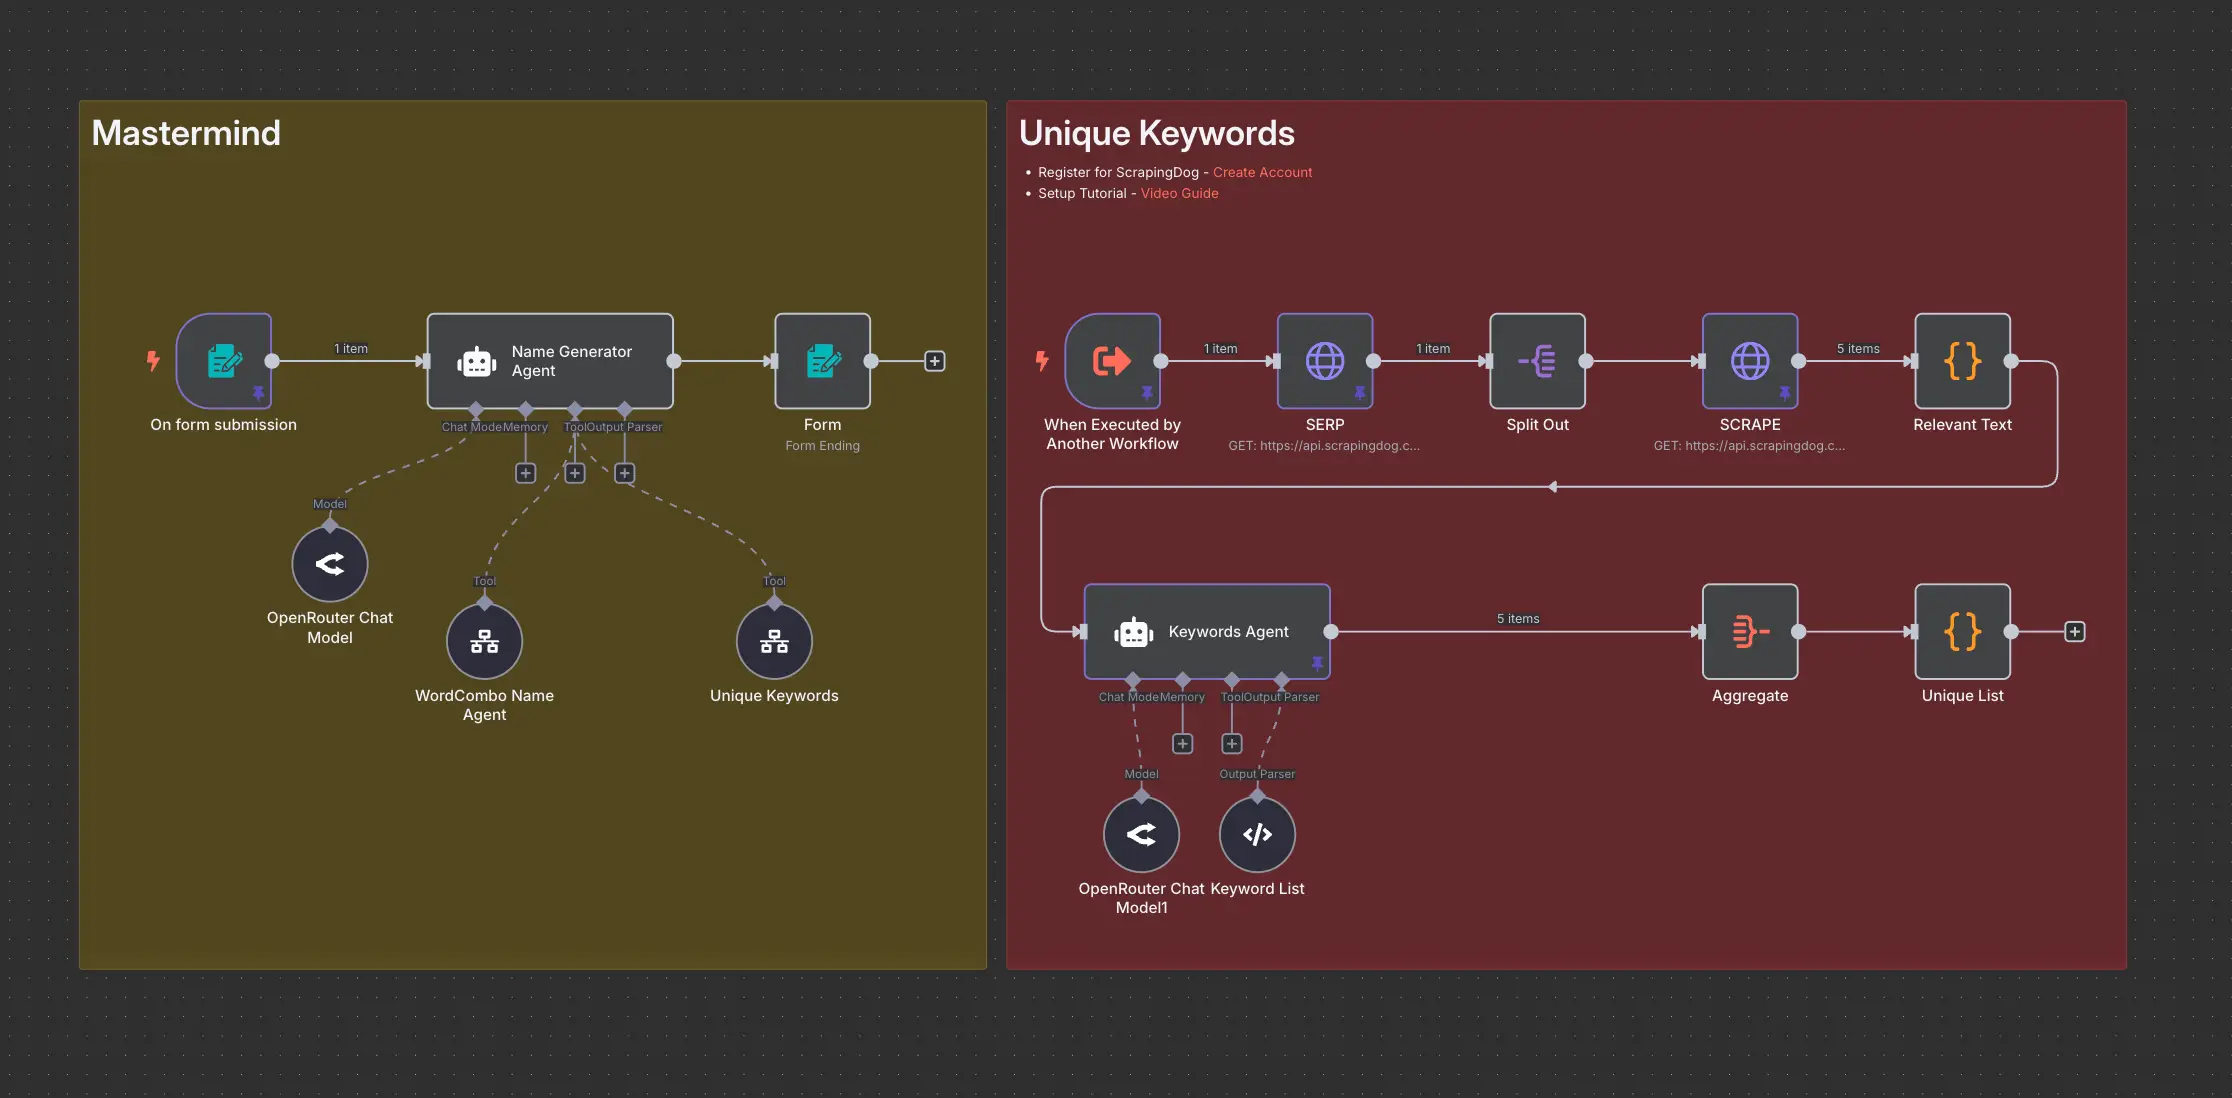
Deep Research using n8n automation to generate report using Tavily