Why does rebuilding Monday ops reports by hand still tax time,


Table of Contents
- Introduction
- Why does rebuilding Monday ops reports by hand still tax time, trust, and revenue?
- What should automated KPI reporting deliver on a small business KPI dashboard?
- Which KPIs deserve automated reporting tools before integrations multiply?
- How do you connect CRM, Stripe, and paid ads into one minimum viable pipeline?
- What orchestration and storage pattern fits automated KPI reporting without enterprise BI?
- Why can alerts outperform extra charts on automated reporting tools?
- What mistakes freeze automated KPI reporting after the first working demo?
- What should you read next before you wire more integrations?
- Frequently Asked Questions (FAQs)
- Next step: map reports to revenue before you build
Introduction
Every Monday, someone on your team opens too many tabs, exports CSVs from the CRM, copies Stripe totals, screenshots ad spend, and tries to make one deck look honest. By lunch the numbers are prettier, but nobody is sure they are true. That is not a discipline problem. It is a pipeline problem.
Automated KPI reporting is how you get the hours back without hiring a data org or buying enterprise BI. The goal is smaller than vendors suggest: pull the few metrics that move revenue into one place, refresh them on a schedule that matches how you decide, and alert when the system or the business drifts. You are building a lightweight path from CRM, billing, and ads into one operational view, not a data warehouse science project.
If you are worried about buying another subscription that nobody uses, read AI Automation ROI: 2-3 Revenue Flows Beat Another Subscription next to this piece. Here we focus on the Monday deck itself: what belongs on a small business KPI dashboard, how automated reporting tools should behave, and where orchestration tools like n8n sit in the stack.
The uncomfortable truth is that most leadership packs are built to survive the meeting, not to steer the business. You smooth outliers, hide empty pipeline stages, and pick a CAC window that flatters last week. Automation will not fix politics, but it does remove the excuse that the numbers were wrong because someone misclicked an export. When the pipeline is boring, the conversation shifts from "is this true?" to "what do we do?" That is the bar you are aiming for.
Why does rebuilding Monday ops reports by hand still tax time, trust, and revenue?
Manual reporting charges three taxes at once.
First, the time tax. A modest weekly pack, CRM export, Stripe MRR movement, Meta and Google spend, maybe Zendesk volume, easily runs two to four hours once you fix broken VLOOKUPs and argue about date ranges. Across a year that is a month of senior attention spent on copy-paste.
Second, the delay tax. If the deck only updates when someone has bandwidth, you react to last week while this week burns cash. CAC can climb for days before Monday.
Third, the trust tax. Marketing quotes leads one way, sales quotes pipeline another, finance quotes recognized revenue a third way. When every number is hand-carried, meetings open with reconciliation instead of decisions.
Automation platforms and hosted integration patterns are far more reachable for SMEs than a decade ago, which is why a focused pipeline is realistic now. You still need taste: you automate the metrics that change how you spend Monday afternoon, not every field the CRM exposes.
There is also a coordination cost hiding inside the deck. Someone chases finance for the revenue number, someone else asks marketing for spend, and a third person pings support for ticket volume. Each ping is small; the total is a distributed full-time job spread across calendars. A single refreshed view does not erase cross-team work, but it collapses the scavenger hunt. That is often where the first real hour savings show up, before you even tune alerts.
What should automated KPI reporting deliver on a small business KPI dashboard?
For a team without a data department, automated KPI reporting should mean four concrete outcomes.
One operational source of truth. The same definitions for MRR, new business, churn, and blended acquisition cost show up in one small business KPI dashboard that sales, marketing, and finance can open before the meeting. If two leaders compare notes, they point at the same tile.
Revenue-linked questions, not decoration. The home view should answer whether you are on track to hit the number, where the funnel leaks, and whether acquisition cost is sane. Sparklines beat novel chart types.
Predictable refresh. Daily for paid media, weekly for pipeline health, monthly for retention curves, pick a cadence that matches decisions. The refresh should run whether or not someone remembers.
Actionable signals. A Slack or email ping when new revenue trails a rolling average, when spend spikes, or when a connector fails beats another silent chart.
Everything else is optional until those four work. That framing keeps you out of the trap where "we automated reporting" means "we bought a BI seat and never finished the joins."
When you design the small business KPI dashboard, bias toward comparisons your team already argues about today. If Monday meetings always debate whether pipeline coverage is healthy against the target, that tile belongs above the fold. If nobody has changed spend based on LinkedIn impressions in two quarters, that metric can wait in an appendix. Dashboards teach behavior: whatever sits in the top row becomes what people optimize, so put revenue leverage there on purpose.
Which KPIs deserve automated reporting tools before integrations multiply?
You should not wire APIs until you know which numbers earn the maintenance cost. A simple test: if this metric doubled tomorrow, what would you fund, cut, or hire? If you do not have an answer, it is not a first-class KPI for automated reporting tools.
Across acquisition, sales, monetization, and retention, most small businesses only need ten to fifteen metrics to steer. Examples: qualified leads per week, cost per qualified lead, win rate, average cycle length, new MRR, payment failure rate, logo churn, net revenue retention. The exact list is yours, but each field should map to cash within a quarter.
That prioritization overlaps with a revenue-first backlog. Use What Should You Automate First? A Revenue-First Prioritization Framework to score candidates before you touch a webhook. If you already know the metrics but need sequencing, pair it with 90-Day AI Automation Roadmap Template (Small Business) so the KPI work lands inside a gated plan instead of an endless side project.
Write a one-page metrics dictionary while you decide: formula, source system, refresh cadence, owner. Definitions are product. Without them, automation just argues faster.
Be explicit about cash timing before you wire anything. CRM "closed won" is not the same as Stripe captured cash. Refunds, taxes, credits, and annual prepay all change what leadership thinks "revenue" means on Monday. Pick one definition for the operating dashboard, label it plainly, and let finance keep their own ledger view if they need a second lens. Mixing definitions inside one tile is how automated KPI reporting earns distrust even when the code runs clean.
How do you connect CRM, Stripe, and paid ads into one minimum viable pipeline?
Think in four layers: sources, orchestration, storage and light modeling, then visualization and alerts.
Sources are the systems of record. CRM holds pipeline stages and owners. Stripe (or Paddle, Chargebee, and so on) holds charges, subscriptions, refunds, and failed payments. Ads platforms hold spend and conversion objects. You only pull the columns that feed your KPI dictionary.
Orchestration is the scheduled glue: nightly jobs or webhooks that extract deltas, normalize currency and time zones, map campaign names to lead sources where possible, and upsert rows into a central place. This is where tools like n8n, Make, or Zapier earn their keep. The pattern is boring on purpose: fetch, clean, write, log.
Storage can be a small Postgres instance, a sheet you treat as a staging table, or the internal store of a modest BI tool. Postgres is usually the best compromise between cost and honesty once you outgrow fragile formulas.
Visualization should be something your team can read in under two minutes: top row revenue and forecast, middle row pipeline and acquisition, bottom row retention and one support signal. Drill-down tabs are fine later.
You do not need a star schema on day one. You need reliable joins on boring keys, which is where most "we tried automation" stories quietly die.
For ads, start with account-level and campaign-level spend and tracked conversions that your CRM can recognize, not every creative variant. For Stripe, pull successful charges, refunds, disputes, and subscription lifecycle events you already use in finance reviews. For the CRM, sync opportunity amounts, stages, close dates, and lead source fields your team actually enforces. Empty CRM hygiene will hurt a dashboard faster than any missing AI feature, so tighten picklists and required fields in parallel with the technical work. Automation magnifies whatever discipline already exists.
What orchestration and storage pattern fits automated KPI reporting without enterprise BI?
Pick orchestration that your team can read six months later. Visual workflow tools shine when three people share ownership and you need audit-friendly logs. Code is fine if one engineer loves it, but vacations still happen.
A nightly pattern works for many SMBs: pull deals touched in the last twenty-four hours, pull charges and subscription events, pull yesterday's ad insights, normalize fields, then upsert into your core tables. Event-driven flows matter when a failed payment or a high-value opportunity stage change should wake someone immediately.
Treat orchestration like any other production job. Version the workflow, keep secrets out of chat logs, and document the happy path plus the top three failure modes. When a vendor API returns a partial page of results, decide whether your job should halt, retry with backoff, or continue with a watermark you can reconcile later. Small choices there determine whether your automated reporting tools feel dependable or flaky.
How do you model joins when email is the only shared key?
Start pragmatic. Email is a weak global ID but it is often the only bridge between a lead form, a CRM contact, and a Stripe customer record. Use it early, then plan a stable customer_id once product and finance agree. Map picklist values from the CRM to channel names your ads export uses so you can later answer "CAC by channel" without hand labels.
Keep derived tables embarrassingly small at first: daily revenue, daily ad spend by platform, weekly funnel counts, monthly churn and expansion. Let views roll those up for the small business KPI dashboard. You can always add grain later; you cannot easily recover trust after silent double counting.
Why do failed syncs quietly destroy trust in automated KPI reporting?
If one connector pauses and nobody notices, every downstream chart lies together. Log each run, alert on HTTP errors, and surface "last successful sync" on the dashboard header. Operational health is part of the product. When finance spots a mismatch, your first question should be whether the pipeline broke, not whether a human typo landed in cell Q19.
Add a lightweight reconciliation habit even when everything is "automated." Once a week, spot-check two KPIs against the native system UI. The goal is not zero variance; the goal is early detection when a field mapping silently drifts. That habit costs ten minutes and saves the emergency Sunday rewrite when leadership notices a hole the night before a board update.
Why can alerts outperform extra charts on automated reporting tools?
Dashboards are pull-based. Alerts are push-based. In a lean team, push wins because nobody lives inside the BI tab.
Good alert tiers look like this. Business alerts when new MRR trails a rolling baseline, when blended CAC jumps outside a band you set from history, or when churn crosses a monthly guardrail. Operational alerts when a sync fails, when API rate limits throttle you, or when row counts drop suspiciously. Optional engagement alerts for high-intent leads untouched in twenty-four hours if that truly changes revenue.
Tune frequency so people do not mute the channel. One meaningful ping beats five anxious ones. This is still automated KPI reporting: the metric crossed a threshold you agreed matters.
When you set thresholds, anchor them to trailing baselines you already trust, not aspirational targets from the strategy offsite. A CAC alert that fires every Tuesday because the model is too tight trains everyone to ignore it. Start wider, watch noise for two weeks, then tighten. The same discipline applies to revenue pacing alerts: compare this week to the same week last month if your business is seasonal, not only to last week.
What mistakes freeze automated KPI reporting after the first working demo?
The first green checkmark is dangerous because it invites scope creep.
Metric inflation is the classic failure mode. Every leader adds "just one more tile" until the small business KPI dashboard becomes wallpaper. Guard the home view fiercely; park experiments on secondary tabs.
Ownerless automation is the second. If nobody owns credential rotation, schema drift when Salesforce renames a field, and documentation when a vendor changes an API version, the pipeline rots. RACI still applies to low-code.
Perfect data paralysis is the third. You do not need full historical parity on day thirty. You need consistent definitions from the go-live date forward, plus a controlled backfill window when you are ready.
If you already burned a sprint on the wrong scope, reset with the frameworks linked above, then re-sequence work instead of buying another "AI insights" add-on.
Another stall pattern is tool tourism: swapping orchestration vendors because a demo looked shinier. The hard part is rarely the drag-and-drop canvas. It is agreeing on definitions, cleaning historical rows once, and keeping credentials fresh. If you change tools without fixing ownership, you replay the same movie with new logos.
What should you read next before you wire more integrations?
Treat reading as part of the implementation. AI Automation ROI: 2-3 Revenue Flows Beat Another Subscription keeps spend tied to a few flows that move revenue instead of another SaaS bundle. What Should You Automate First? A Revenue-First Prioritization Framework helps rank CRM versus support versus admin work honestly. 90-Day AI Automation Roadmap Template (Small Business) gives week-by-week gates so KPI automation does not swallow the roadmap whole.
Next step: map reports to revenue before you build
You do not need more charts on Monday. You need agreement on which numbers tie to revenue, a thin pipeline that feeds them reliably, and alerts when reality drifts. If you want help choosing the right reports and sequencing CRM, billing, and ads pulls before you sink weeks into the wrong dashboard, reserve your roadmap call and we will map the KPI set to cash first, then decide what to automate.
Frequently asked questions
Quick answers on the topics covered in this article.
It is scheduled pulls from your core systems into one trusted view, with clear definitions and alerts, so leaders spend time on decisions instead of exports.
No. You need one accountable owner, boring keys, a small storage target, and orchestration you can debug. Hire help for design and hard joins, not a standing twelve-person analytics org.
Start with whatever your operators can maintain: workflow tools such as n8n, Make, or Zapier for orchestration, plus Postgres or a spreadsheet staging layer, then a simple BI or sheet-based front end. Match the tool to maintainers, not headlines.
Match refresh cadence to how fast you can act. Daily for paid spend and high-volume leads, weekly for pipeline conversion, monthly for retention economics. Faster is not automatically better if nobody reads it.
Often yes, through native integrations or workflow nodes, but you still need a plan for IDs, refunds, currency, and partial month reporting. Expect some SQL or formula work at the modeling layer.
Silent drift: renamed fields, partial syncs, double-counted revenue, or timezone mistakes that look fine until finance reconciles. Invest in logging and "last good run" visibility early.
Yes. Reporting that nobody opens is not operational. Threshold-based alerts are the push half of the same system.
Optional. Summaries help narrative updates once numbers are trustworthy. They do not replace definitions, joins, or ownership. Fix the pipeline before you ask a model to explain it.
Measure reclaimed leadership hours, faster detection of CAC or churn moves, and fewer pre-meeting reconciliation threads. If Monday prep time drops materially, the project paid rent.
Scheduled export to a sheet, validated formulas, one chart pack, and email alerts on thresholds. It is not fancy, but it is honest if you guard definitions. Upgrade to a database when formulas become the risk.
[[banner-roadmap-call]]
Share this article
Related workflows
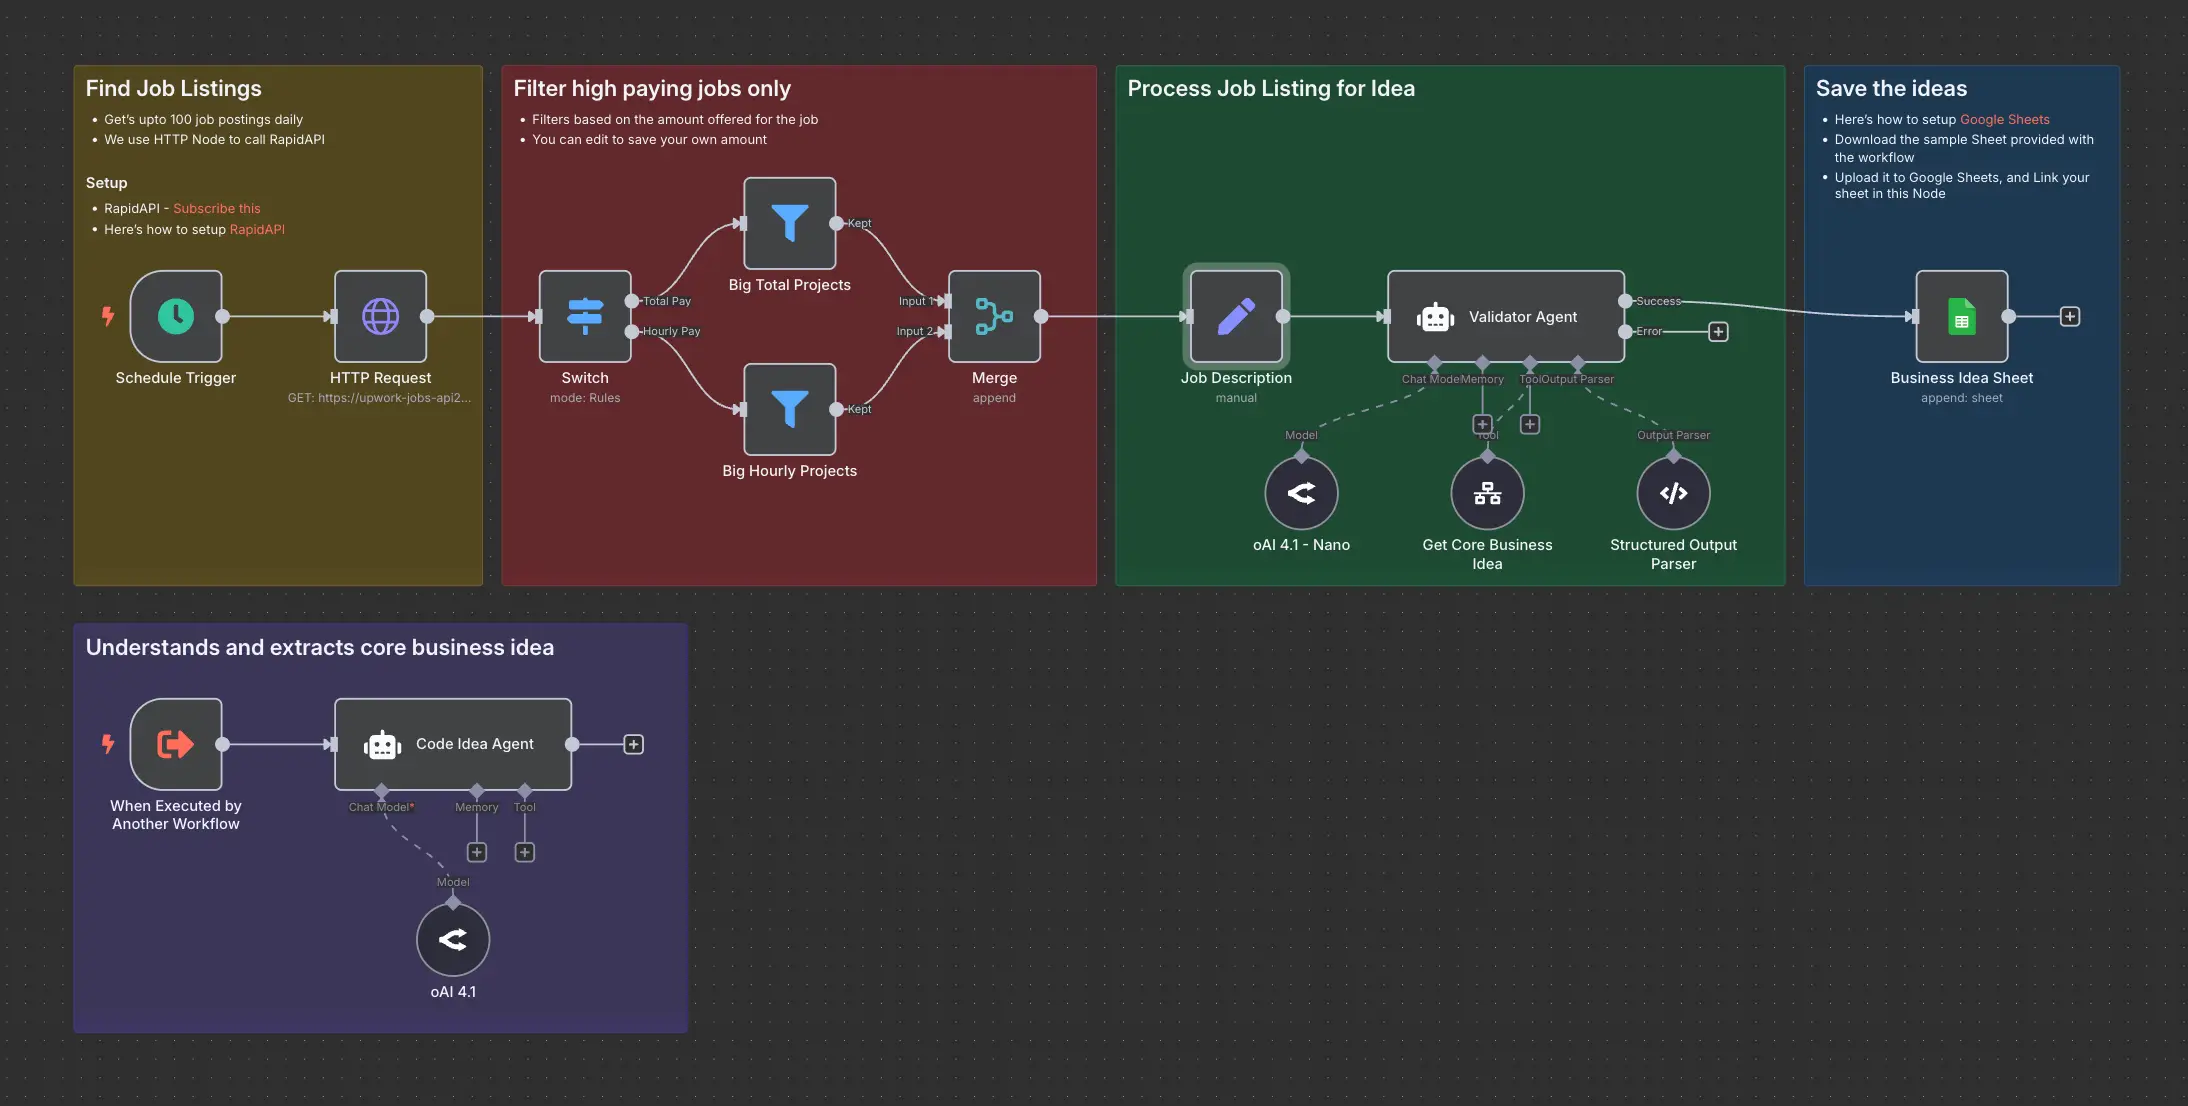
Daily Validated Business Ideas using n8n and Upwork
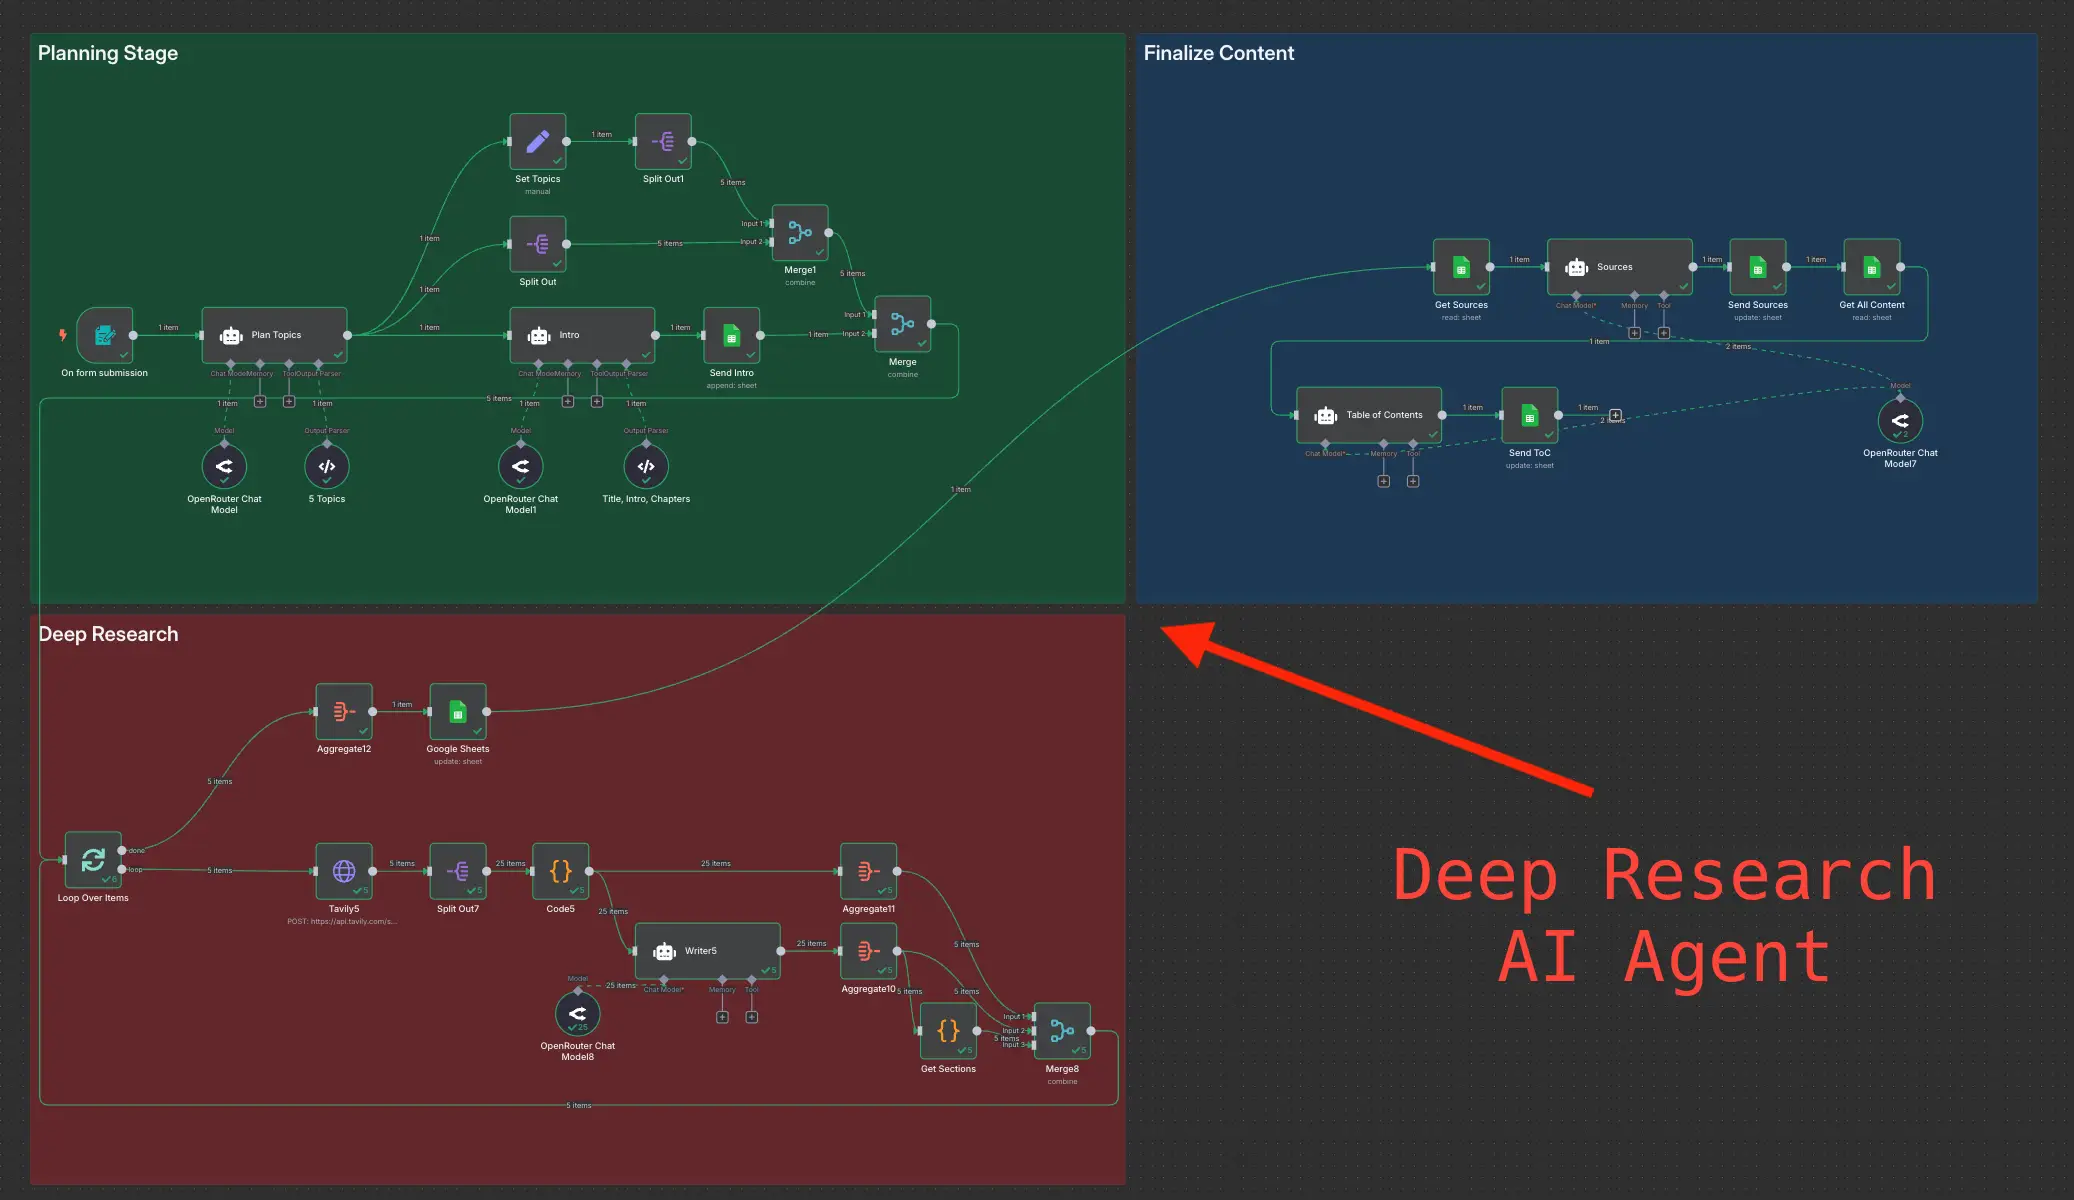
Deep Research using n8n automation to generate report using Tavily